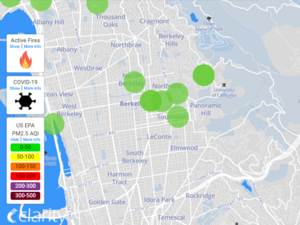
Air quality may change quickly depending on wildfire intensity and weather conditions. The Campus Air Quality Map is updated hourly and reports data as “Current AQI” using the EPA’s PM2.5 NowCast AQI algorithm. Refer to the UC AQI Decision-Making Matrix for recommended actions. The AirNow Fire & Smoke map is also an excellent resource to view regional air quality, fire incidents, and smoke plumes.
Reference Monitors
Current Air Quality Index (AQI) is used by the U.S. Environmental Protection Agency to report air quality. Current AQI, referred to as the “NowCast,” is reported hourly for fine particulate matter of diameter 2.5 microns or less (PM2.5), the primary air pollutant of health concern during regional wildfire smoke events. The nearest reference monitors to the UC Berkeley campus are at Berkeley Aquatic Park, Laney College in Oakland, and on West Grand Avenue in Oakland. Reference monitors are integrated into the campus map above and may be viewed by zooming out, or accessed directly via AirNow.gov. You may also sign up to receive regional air quality advisories and alerts based on these monitors via the Bay Area Air Quality Management District (BAAQMD).
Sensors
Low-cost optical sensors such as PurpleAir that count particles in air provide supplemental environmental data. It's important to recognize these sensors are not maintained and calibrated like reference monitors; however, these sensors are valuable to view spatial trends in a community or compare indoor/outdoor conditions. Please note, sensors may report high during wildfire events due to the composition of wildfire smoke having particulates (ash) of lower density than dust. Also – one minute or 10 minute readings will fluctuate more than results averaged over longer time periods like the EPA's NowCast algorithm.
Pilot Project using Clarity PM2.5 Sensors
AQI data viewable at the map above or via openmap.clarity.ioand is used to evaluate local campus conditions. Multiple PM2.5 sensors, including some solar-powered sensors, have been installed on the roof of University Hall, VLSB, Crossroads, Stanley Hall, and at Lawrence Hall of Science. The Stanley Hall sensor is at the highest elevation on the central campus (excludes LHS) and will usually indicate the highest AQI reading. This sensor is the primary one referenced for smoke related campus-wide actions. This network may expand; additional data points will be shared on the map above. A California-specific wildfire smoke correction factor has been applied to the data presented on this map, based on co-location studies of Clarity PM2.5 sensors at reference monitor sites. You may co-display campus sensor data with nearby reference monitors by clicking on data points and choosing “show in plot.” EH&S has also installed some indoor sensors to evaluate indoor air quality; these indoor data points are not posted to the public map but are monitored to assist with campus decision-making. Please contact EH&S at 510-642-3073 orehs@berkeley.edu regarding indoor air quality concerns.

